Deep Dive Sep 24, 2026
Moratoriums have delayed only about 2.3GW: the figure counts delay alone and scores cancelled and relocated projects as zero

Published September 24, 2026; rewritten October 23 to the current standard. The main call is unchanged.
Key takeaways
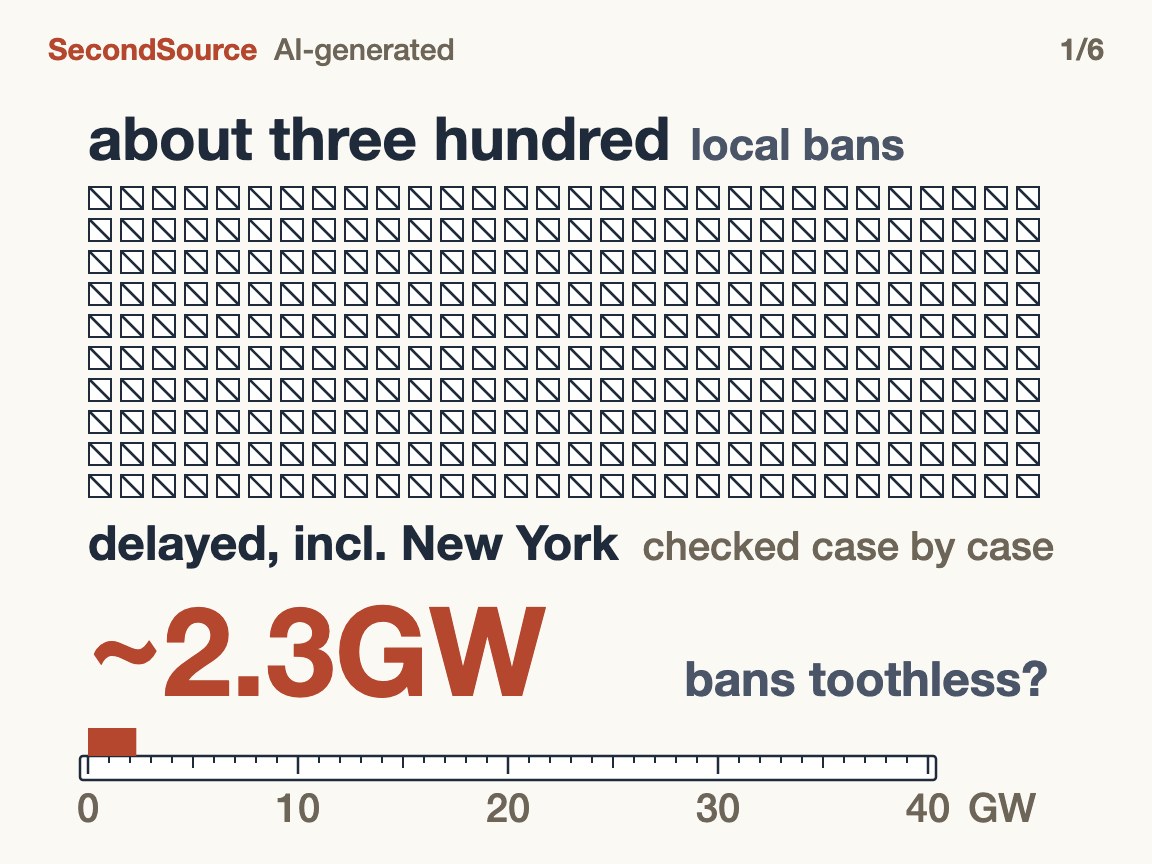
About 300 local measures across the US, plus one New York State order, now pause or ban new data centers (large computing facilities); this piece calls them all moratoriums. How much have they slowed building? SemiAnalysis, a research firm, found in September that the capacity actually delayed by them is about 2.3GW: about 1.5GW from local moratoriums and 0.8GW from the New York order. A GW (gigawatt) is a billion watts and measures how much power a data center can use. The figure counts only projects that stay in place and wait. Cancelled projects, and those that move or are redesigned, together called exits here, all score zero. On September 16 this publication made five calls based on 2.3GW; this piece re-checks each.
The conclusion first: forecasters of 2026 and 2027 completions need not cut for moratoriums, but 2.3GW cannot count exits, so it cannot show that moratoriums do nothing. Three takeaways:
1. Forecasters of those two years should change their reason for not cutting from "2.3GW is small" to "most of those projects have broken ground or hold all their permits". On September 16 this publication divided 2.3GW, a total not split by year, by 2027's US new capacity and said the delay was about six percent of it; anyone citing that six percent should drop it.
2. Anyone citing 2.3GW to say moratoriums do nothing leaves out exits. Heatmap, an energy news site, counted at least twenty proposals cancelled after local opposition in this year's first quarter, not only where moratoriums applied; no one has tracked whether they were built elsewhere. Yet SemiAnalysis and Princeton professor Arvind Narayanan (who estimated that a full New York ban would slow AI by less than a day) both assume projects can move, that is, get built elsewhere instead. Anyone citing either estimate should not treat "moratoriums matter little" as settled.
3. Developers and lenders should not assume that moratoriums only make projects move. First compare cancellation rates, the share of projects cancelled inside a moratorium's reach versus outside it, then check whether the cancelled ones are made up elsewhere; no one has computed the rates yet.
This piece calls SemiAnalysis's counting method its yardstick: every moratorium is matched to the 6,000-plus data centers SemiAnalysis tracks, and a project counts as delayed only when all eleven conditions hold (for example, the moratorium reaches that parcel). Sections two and three cover 2.3GW, four and five what the yardstick misses, and six the missing reading.
One: First, a few terms: moratorium, delay, exit
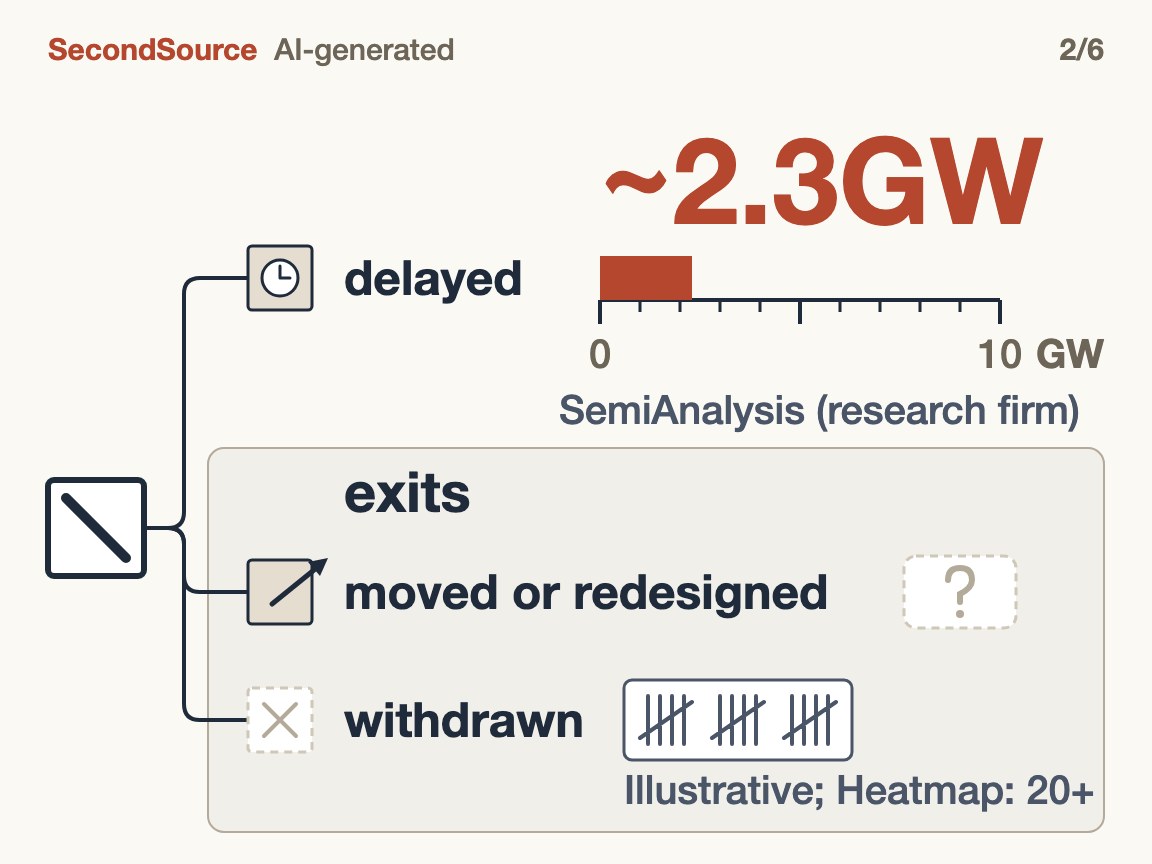
A moratorium usually only pauses new applications; permits already issued are almost never revoked, and a data center takes years to go from permit to completion.
When a moratorium really does block a project, there are three outcomes:
- Delay: the project stays in place and is still planned, waiting for the moratorium to expire or be lifted. A developer that sues to challenge the moratorium and waits in place during the case also counts here.
- Relocation or redesign: the project moves to another site, or is redesigned, for example by switching to on-site power when the moratorium covers only grid connections.
- Cancellation: the developer drops the proposal.
The last two are exits. Where a moratorium reaches depends on who issued it: a city's covers only land inside city limits, while a county's usually covers only the county's unincorporated land. A project the moratorium cannot reach, including one whose land is simply moved out of the moratorium's area with no change of site or design (this piece calls that being carved out), is in none of the three; it counts as unaffected.
What the two firms count. SemiAnalysis's list records data centers one by one and also underlies its model forecasting US completions; the yardstick applies eleven conditions to the list to pick out delayed projects. Heatmap goes through news and public records, counting proposals cancelled after local opposition. SemiAnalysis's about 2.3GW is server power; Heatmap's at least 3.5GW is first-quarter cancelled proposals, measured as whole-campus power demand, larger than server power, so the two cannot be compared or added.
The five calls of September 16. This publication's (SecondSource's) re-check:
| The September 16 call | Result of the re-check |
|---|---|
| 1. The fear that the moratorium wave will wreck 2026–27 deliveries can be set aside | Holds (section three) |
| 2. The delay is about six percent of 2027's new capacity | Withdrawn (section three) |
| 3. This yardstick cannot see unsited projects from 2028 on | Rewritten: what it misses is exits, not 2028 and later (section five) |
| 4. SemiAnalysis and Narayanan use different methods and agree, so they corroborate each other | Narrowed: both assume projects can move (section five) |
| 5. Local resistance shifts building to places moratoriums cannot reach: inside city limits, approved parcels, on-site power | Right direction, single cases only, no count (sections three, four, six) |
So anyone citing the September 16 piece should follow the right column: drop call two, use this piece's versions of calls three and four, and treat call five only as a direction.
Two: How 2.3GW was calculated: a project counts as delayed only when all eleven conditions hold
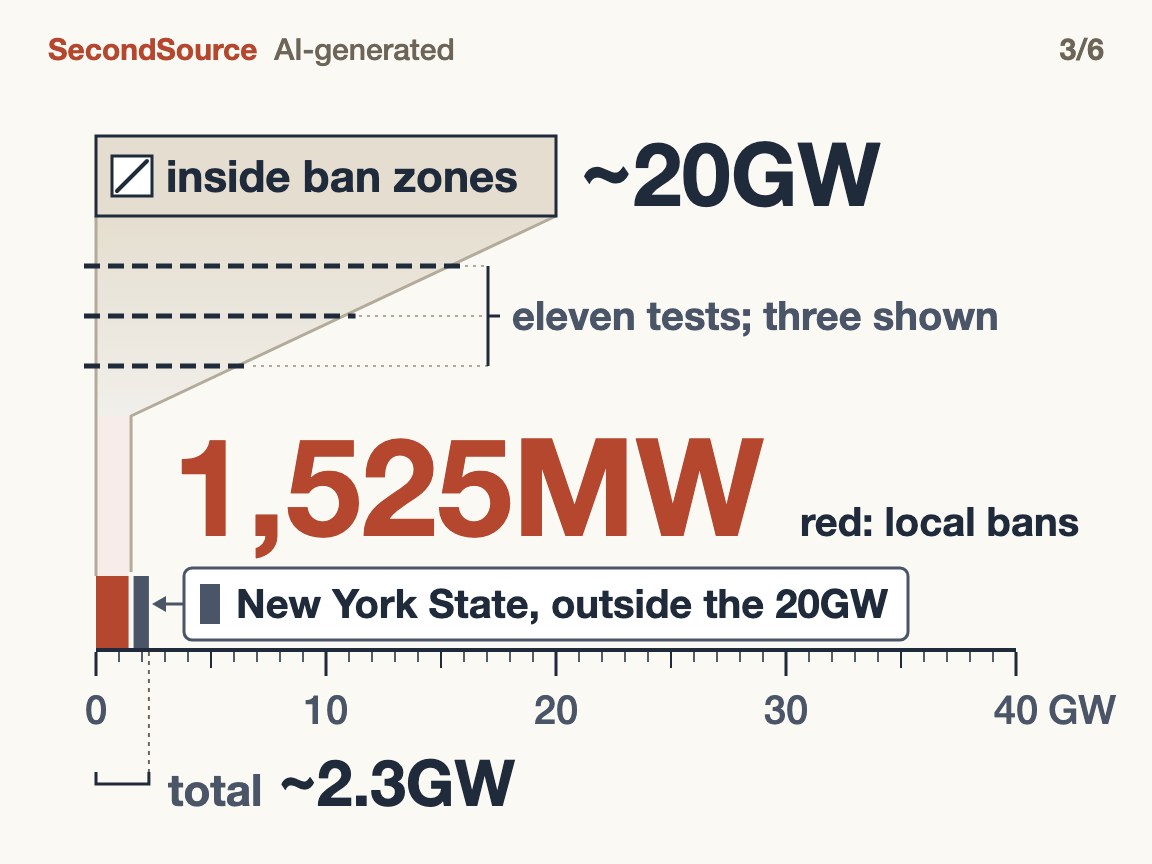
2.3GW has two parts. For the local part, SemiAnalysis matched each of the roughly 300 moratoriums in force to the parcels on its list:
- Capacity inside a moratorium's reach: about 20GW.
- Capacity actually delayed as a result: 1,525MW (an MW is a million watts; 1,525MW is about 1.5GW), 7.6% of the first figure (SemiAnalysis's calculation).
The New York part is counted separately: Governor Hochul's July executive order pauses only applications for state permits for data centers of 50MW or more. It touches about 1.4GW, and SemiAnalysis estimates about 0.8GW is actually delayed. That better-than-half ratio cannot be compared with 7.6% because the denominators differ: 7.6% divides by all capacity inside local moratoriums' reach, before any screening, the New York ratio by capacity already screened once.
Screening 20GW down to about 1.5GW takes eleven conditions (all listed in the appendix). The three that screen out the most projects:
- Does the moratorium reach this parcel? For example, a county moratorium does not reach a campus inside city limits (section one).
- Does the project still need the frozen permit?
- How far is the project from applying for that permit? A project scheduled to finish in 2028 or later, facing a moratorium of only three to six months, can simply apply after the moratorium expires.
1.5GW comes almost entirely from three projects (see the appendix), so it can be trusted to mean "very little delay", not as a precise figure. The longer a moratorium, the fewer projects the "apply after it expires" condition screens out; so those tracking moratoriums should watch, beyond how many there are, whether new ones run longer.
Three: 2.3GW is right; dividing it by 38GW is the mistake: the 2027 projects mostly cleared the moratorium gate long ago
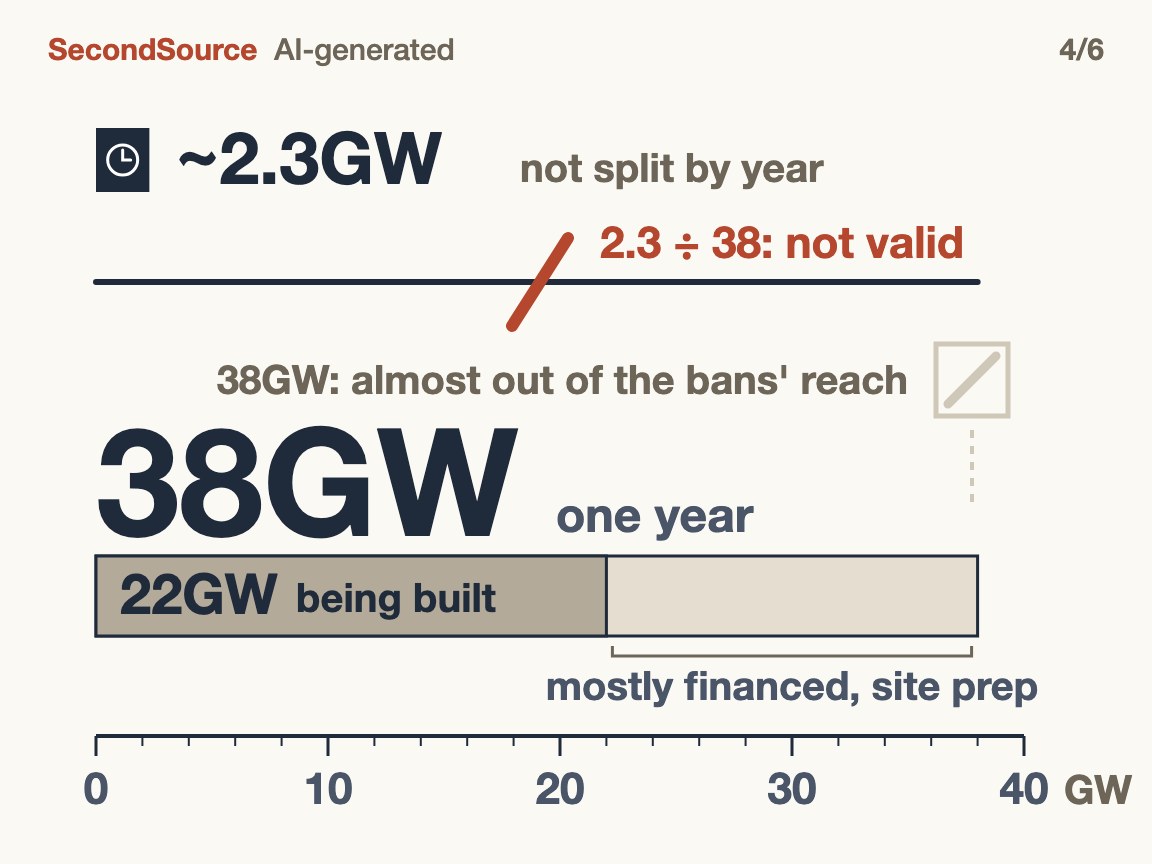
Takeaway 1 says the reason is permits, not a small 2.3GW. The second September 16 call divided 2.3GW by SemiAnalysis's forecast of 38GW of new US capacity in 2027, getting six percent (this publication's calculation). The two figures cover different time spans.
38GW is a single year and almost out of the moratoriums' reach. SemiAnalysis writes that of the 38GW (measured as server power), 22GW is already under construction and the remaining 16GW is mostly financed and doing site work. Capacity under construction or fully permitted is out of the moratoriums' reach, and that covers all of 2026 and most of 2027.
2.3GW is not split by year. It is the total delayed right now, some of it in 2027 and some later; dividing that total by one year's additions gives a percentage with no clear meaning.
What could slow these two years is something else. Goldman Sachs estimated in May that only 50 to 60 percent of the capacity scheduled to come online in the next year or two will be on time; SemiAnalysis writes that issues such as equipment lead times may already be gating schedules. So those forecasting the two years should watch issues such as equipment lead times, not the moratoriums.
Four: The yardstick scores relocated and cancelled projects as zero
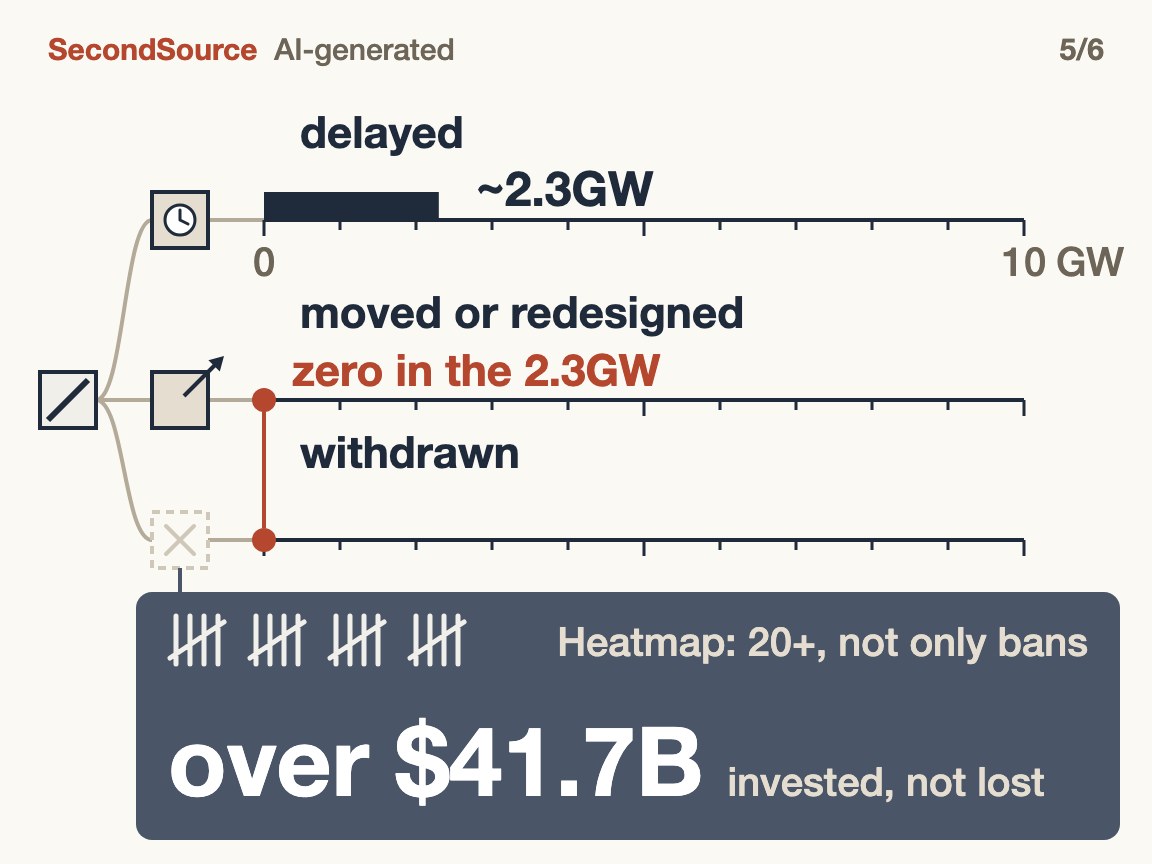
The exits in takeaway 2 come from the yardstick's rules. One of the eleven conditions: a project cancelled, withdrawn, downsized or abandoned does not count as delayed (the downsized part counts as cancelled). SemiAnalysis also writes that even where a moratorium does hold up the schedule, the developer can usually relocate, redesign or challenge it rather than abandon it. By section one's categories, a challenge still counts as delay; relocation and redesign are exits.
SemiAnalysis forecasts US completions; a project built elsewhere does not reduce the total, so this scoring is reasonable. A carved-out project is scored as unaffected: days before the vote on a moratorium in Brownsville, Texas, the city and Elon Musk's side, which planned to build a data center inside city limits, took the 444-acre site out of the city limits, beyond the city moratorium's reach.
Someone does count cancellations, and the count is not small. Heatmap reported in May that in the first three months of 2026 at least twenty proposals were cancelled, together over $41.7 billion of investment and at least 3.5GW of power demand. A July update: of about 430 projects that faced a local challenge over the past five years, about 40 percent were eventually cancelled, recently rising to about half.
Heatmap's count covers a different group from 2.3GW, so the figures do not conflict. But about half of opposed projects are cancelled, and SemiAnalysis's "can usually" move remains untested.
The cancellation count is an upper bound. Many proposals are speculative: Goldman Sachs writes that developers often file in several places at once and pursue only the best one. So anyone using cancellation counts to estimate losses should treat them as an upper bound.
Five: What this yardstick cannot see is exit, not 2028 and later
The third call said this yardstick cannot see unsited projects from 2028 on; it is only half right.
Announced projects for 2028 and later are on the list (a separate SemiAnalysis report in June), handled by the yardstick's "apply after it expires" condition.
What it cannot see is exits: relocated or redesigned projects and cancelled ones score zero in every year. Projects never proposed because a moratorium was expected are on no list at all; that is the only part the third call got right, and it is not a blind spot peculiar to this yardstick. Heatmap counts cancellations; for relocations and never-proposed projects, this publication found no public figures.
The fourth call needs narrowing. Narayanan's conversion: AI computing efficiency improves every year, so blocked computing power is soon made up. The conversion states that it assumes 90 percent of blocked capacity gets built elsewhere. 2.3GW scores relocation as not delayed, so using it for the moratoriums' whole effect likewise assumes projects can move. With the same premise, the two do not corroborate each other.
SemiAnalysis records an example in metro Atlanta: activists around Fayetteville pointed to pauses in neighboring counties while pushing for one locally. The more such follow-ons, the harder it is for projects to move; so anyone citing 2.3GW or Narayanan to say moratoriums matter little should first check whether neighboring counties are following.
Six: Whether projects move or vanish shows up only in cancellation rates inside versus outside a moratorium's reach
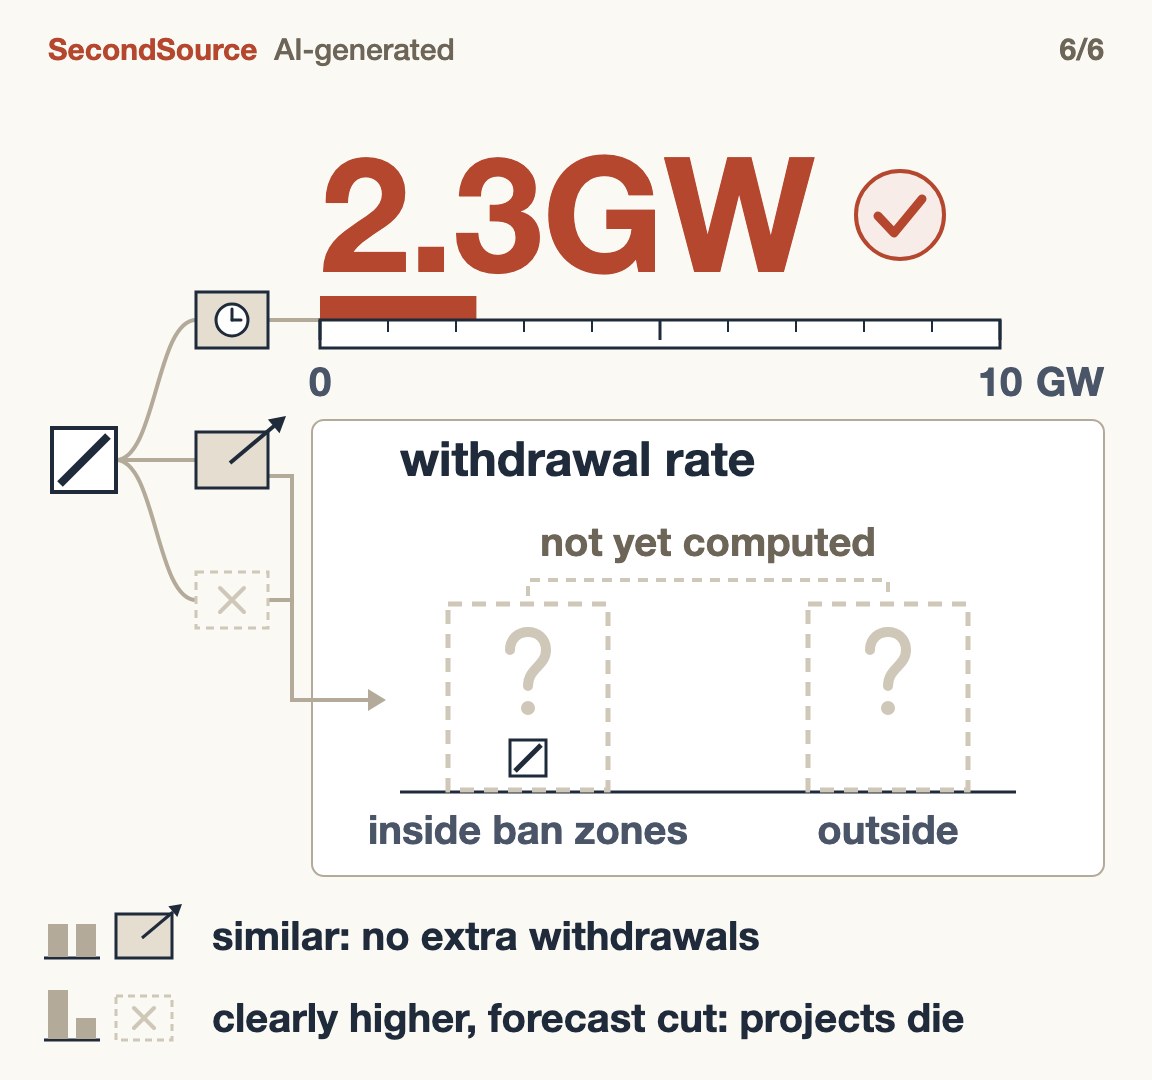
The cancellation rate in takeaway 3 is read in two steps.
Step one: do moratoriums push out extra cancellations? Split the listed projects into inside and outside a moratorium's reach and compute each group's cancelled share. If the two are close, moratoriums push out no extra cancellations; if the inside share is clearly higher, the excess is theirs.
Step two: are the pushed-out cancellations made up elsewhere? Watch whether SemiAnalysis's US forecast is cut: if not, projects moved; if it is cut because of moratoriums, moratoriums are killing projects.
Until then, there are only single cases and one-sided statements:
- Redesign making up building: Texas Governor Abbott ordered that the queue to connect to ERCOT (the body that runs most of the Texas grid) not move to its next step for now, which is not a moratorium. SemiAnalysis estimates that projects needing grid power wait about three to four months longer; on-site-power projects are unaffected and growing faster, making up the building lost to the grid delay.
- Moving: Peter Freed, former director of energy strategy at Meta, told Heatmap in July that developers increasingly stop in communities that pass restrictions and shift elsewhere, but shifting is not the same as having built.
- Projects vanishing: Microsoft's fiscal 2026 annual report lists state and local moratoriums among its risk factors, a precautionary listing that carries little weight.
None of these single cases and one-sided statements settles either side; so until the cancellation rate is computed, developers planning projects for 2028 and later should not count on moving to escape moratoriums.
Our call
Back to the opening question, how much have moratoriums slowed building: for 2026 and 2027, hardly at all, because those projects have cleared the permit stage (section three); the 2.3GW delay figure is right, but it cannot count exits (sections four and five). Over the next year, those following this should watch whether cancellation rates get published and whether SemiAnalysis cuts its 2028 US forecast because of moratoriums (section six).
What this changes, and for whom
Developers choosing sites for 2028 and later should not put all their backup parcels in one region whose localities follow one another's moratoriums; lenders reviewing new projects should, until cancellation rates exist, check whether the county and neighboring counties are pushing moratoriums, not just the delay figure.
What would prove this wrong
1. Cancellation rates inside and outside a moratorium's reach are published and come out close: takeaway 2's warning about exits is withdrawn.
2. A count of relocations is published, showing most exiting projects get built elsewhere: the premise that projects can move holds, and takeaway 2's reservation is withdrawn.
3. Actual US completions in 2027 come in clearly below 38GW, and the shortfall can be traced to moratoriums: section three is wrong. Tentative date to check: March 31, 2028.
The first two are watched until June 30, 2027; the thresholds and deadlines for all three are this publication's own.
Appendix: how the numbers were obtained
How 2.3GW breaks down
| Part | Capacity covered | Actually delayed | Who calculated |
|---|---|---|---|
| Local moratoriums (county, city, town; about 300 in force) | About 20GW | 1,525MW (7.6% of the capacity covered) | SemiAnalysis |
| New York State executive order | About 1.4GW | About 0.8GW | SemiAnalysis estimate |
| Total | — | About 2.3GW | SemiAnalysis |
The local 1,525MW of delay comes almost entirely from three projects: an AWS campus in Ohio, a powered-land developer's campus in Pennsylvania and a site in Colorado (SemiAnalysis's public section gives no per-project MW).
SemiAnalysis's 38GW, 20GW and 2.3GW all measure IT capacity (power for the servers). Heatmap's 3.5GW is electricity demand.
Two ratios
- "About six percent" = 2.3GW ÷ 38GW, the calculation in the plain-language passage of this publication's September 16 call; section three explains why the ratio has no clear meaning.
- 7.6% = 1,525MW ÷ about 20GW, SemiAnalysis's calculation: how much of the capacity inside a moratorium's reach is actually delayed.
- New York: about 0.8GW ÷ about 1.4GW, more than half, SemiAnalysis's estimate. It cannot be compared with 7.6% because the 1.4GW was already screened once (SemiAnalysis does not say how), so the denominator is smaller.
Other counts and supporting evidence
- SemiAnalysis's data: the data-center list is built site by site from property records, permits, power-use data, public-records requests and satellite imagery. The moratorium database records each moratorium's course from proposal and enactment through expiry, lifting and replacement to rejection. The delayed Pennsylvania campus belongs to a developer that first lines up land and power, then hands the site to a data-center operator.
- Moratorium counts: earlier readings were mostly counts of moratoriums, rising from 127 in July to more than 300 in September. A count says how many places object, not how much power is stuck. SemiAnalysis's database holds 400-plus local ordinances and proposals in 17 states, including expired and rejected ones; about 300 are in force.
- How Heatmap counts: Heatmap's data team goes through news, public records and project announcements, counting data-center proposals cancelled after local opposition. In the July piece a "challenge" means lawsuits, physical protests, contentious public hearings or ad campaigns; about 430 projects were contested over five years, and about 200 are being fought now. Cancellation rates vary by state: 71% in Michigan, 56% in Indiana, about 17% in Texas.
- Projects left off the list: announced projects SemiAnalysis judges unlikely are not listed, so the yardstick cannot count them either; this publication found no public figures for them.
- How to compare cancellation rates: if the list records a move as a cancellation at the old site, the share inside a moratorium's reach will read high, so the new sites must be checked to tell moves from cancellations.
- Narayanan's calculation: Narayanan takes AI inference efficiency to improve about fivefold a year and data-center capacity to grow about 25 percent a year, and converts blocked computing power into the time efficiency gains need to recover the same capability. A typical one-year state moratorium comes to five to ten hours; a full New York ban, assuming 90 percent moves elsewhere, to less than a day. Narayanan says the analysis was done with AI and only spot-checked, so the specific numbers should not be taken as precise.
- Seventy-seven campuses: a financial news site separately reported that the research team first circled 77 campuses, about 20GW, and that three remained after screening. This is a second-hand report; this publication has not read the original wording.
- Speculative proposals: SemiAnalysis wrote in June that the queue of large power users waiting to connect to the US grid exceeds 1,000GW, the vast majority highly speculative.
- Data Center Watch (a research group tracking local opposition to data centers): in the first quarter of 2026, at least 75 data-center projects, about $130 billion, were blocked or delayed. The definition counts both local denials and developers' own withdrawals. In August this publication recorded a Bloomberg reporter's figure of "75 in the first three months of the year" and noted that the counting method was entirely unknown. Given the matching number and time window, the source is very likely this report.
- Goldman Sachs: forecast in May that 2027 US additions would reach 36.3GW, close to SemiAnalysis's 38GW. Goldman Sachs does not state whether the figure is server power or grid-connected capacity, so this publication does not use that figure as support.
- On-site power orders: in early September SemiAnalysis counted 75GW of confirmed orders for on-site (behind-the-meter) generating equipment, with Texas taking the most. This publication has not found how many years the orders cover or whether all go to data centers, so the figure is not compared with the single-year 38GW.
- Microsoft annual report: the risk-factor text says state and local moratoriums could delay projects, restrict development opportunities and raise costs.
- Michigan: Michigan has enacted 45 local moratoriums, the most of any state. Yet among the projects SemiAnalysis tracks, Michigan's capacity inside a moratorium's reach is effectively zero. This publication guesses that opposition kills projects at the proposal stage, before a moratorium could delay them. Or developers may simply have chosen Michigan less often. Neither SemiAnalysis nor Heatmap says so, and this publication cannot tell which explanation holds.
New York State and Loudoun County details
- New York State's July executive order: per Foley & Lardner's summary, the order pauses only applications for state discretionary permits for data centers of 50MW or more. Applications the state environmental agency had already deemed complete are unaffected, and permits issued by local governments are outside the order's scope. The order sets no fixed end date.
- Loudoun County, Virginia: according to local media, the September 15 vote directed staff to draft a pause on new applications of up to twelve months. Approved projects keep approvals, and a final vote is scheduled for October.
The eleven conditions (as SemiAnalysis lists them; if any one fails, the moratorium does not count as delaying the project)
1. The moratorium reaches the parcel (a county moratorium usually does not reach land inside city limits).
2. The moratorium has been enacted and is still in force: not a proposal, and not lapsed, lifted or replaced.
3. The moratorium's timing overlaps the project's schedule.
4. The project does not yet hold the permit: many projects that have not broken ground already have the permit in hand.
5. The project is not too far off: a project due in 2028 or later, facing a moratorium of only three to six months, can simply wait for the moratorium to expire.
6. The moratorium covers this use: most moratoriums apply only to large facilities above a certain power draw or floor area, or only to cryptocurrency mining.
7. The project actually needs that permit: for example, a project built on federal land, which follows a separate permitting route, does not.
8. The developer cannot redesign around the moratorium: for example, if a moratorium covers only grid connections, the developer can switch to on-site power.
9. The project is still going ahead: projects cancelled, withdrawn, downsized or abandoned do not count.
10. No existing right or alternative route gets around the moratorium: for example, a development agreement, vested rights, or protection from a new rule applying retroactively (grandfathering).
11. No exemption applies: for example, a public-utility exemption, a consent judgment or state preemption.
Notes on this publication's September 16 call
The results for each of the five sentences are in the table in section one. The third sentence came with its own condition for proving it wrong: "the SemiAnalysis public model includes a layer of projects not yet on the list, and that layer also reads low". The layer's existence is now public, but the reading has not been published, so the condition is only half met.
Placing this on the trends this publication tracks
On October 7 this publication added a trend, "Which level of government US data-center resistance finally lands on", which tracks who holds the pen, not the effect of moratoriums. A trend built around the effect of moratoriums (delay, relocation, cancellation) does not exist yet. The reading that matters most, cancellation rates inside and outside a moratorium's reach, is not available, and Heatmap is the only outlet counting cancellations. This piece therefore carries no trend tree. That trend will be built once a second cancellation count exists, with this piece's conditions 1 and 2 as reversal conditions and observation to June 30, 2027.
Sources
Compiled mechanically from the fact records this piece cites; each entry is the source of one of those facts. Whether this publication read the original document or only a report about it is as stated in the relevant passage of the main text.
- SemiAnalysis, 2026-09-15: Everyone Says Datacenter Moratoriums Are Killing the US Buildout. We disagree
- X / @BrodyFord_, 2026-08-19: x.com/BrodyFord_/status/2090100185187910045
- X / @random_walker, 2026-08-24: x.com/random_walker/status/2091906235670925377
- X / @kevinsxu, 2026-09-08: x.com/kevinsxu/status/2097405506885157376
- DatacenterDynamics, 2026-09-18: Virginia's Loudoun County board votes to pause new data center applications
- WJLA, 2026-09-16: Loudoun County votes to pause new data center applications
- Daily Business, 2026-09-16: Holyrood votes to pause expansion of data centres
- Friends of the Earth Scotland, 2026-09-16: Politicians dilute motion calling for moratorium on AI data centres
- X / @TheStalwart: x.com/TheStalwart/status/2077030191705080256
Other original documents this piece read directly (each sentence checked against the original during the October 23 rewrite):
- SemiAnalysis, 2026-06-18: Stop Saying Half of 2026 US Datacenter Capacity Is Canceled
- Heatmap News, 2026-05-06: Exclusive: Local Opposition to Data Centers Explodes in 2026
- Heatmap News, 2026-07-30: Exclusive: Over 530 Local Laws Now Seek to Ban or Restrict Data Centers in U.S.
- Data Center Watch, Q1 2026 report: datacenterwatch.org/q1-2026
- Goldman Sachs, 2026-05-20: US Data Center Power Demand Projected to Double by 2027
- Microsoft, FY2026 10-K (2026-07-29): msft-20260630.htm
Written from the same research and judgments as the Traditional Chinese edition. Sources are linked; original documents are kept distinct from reporting about them, and unverified points are marked as such.